
Monitoring Everything
Sometimes the best inspiration for a project is a completely unrelated problem. This time, I have to thank my local power company for several power outages that prompted me to buy a couple of UPSes (backup batteries) to prevent any data loss – particularly on my NAS server that runs 24/7 and stores all my media.
Modern UPSes support connecting over serial or USB to report their status so that any attached computers can safely shut themselves down when the battery runs flat. This includes metrics like current charge, voltage, expected runtime, and so on, which we’ll store and visualize with our monitoring stack.
At the end of the day, you can use this stuff to track all sorts of metrics, not just for UPSes, but we’ll see how this particular requirement made the setup a lot more interesting.
Overview
Here’s what we’re working with:
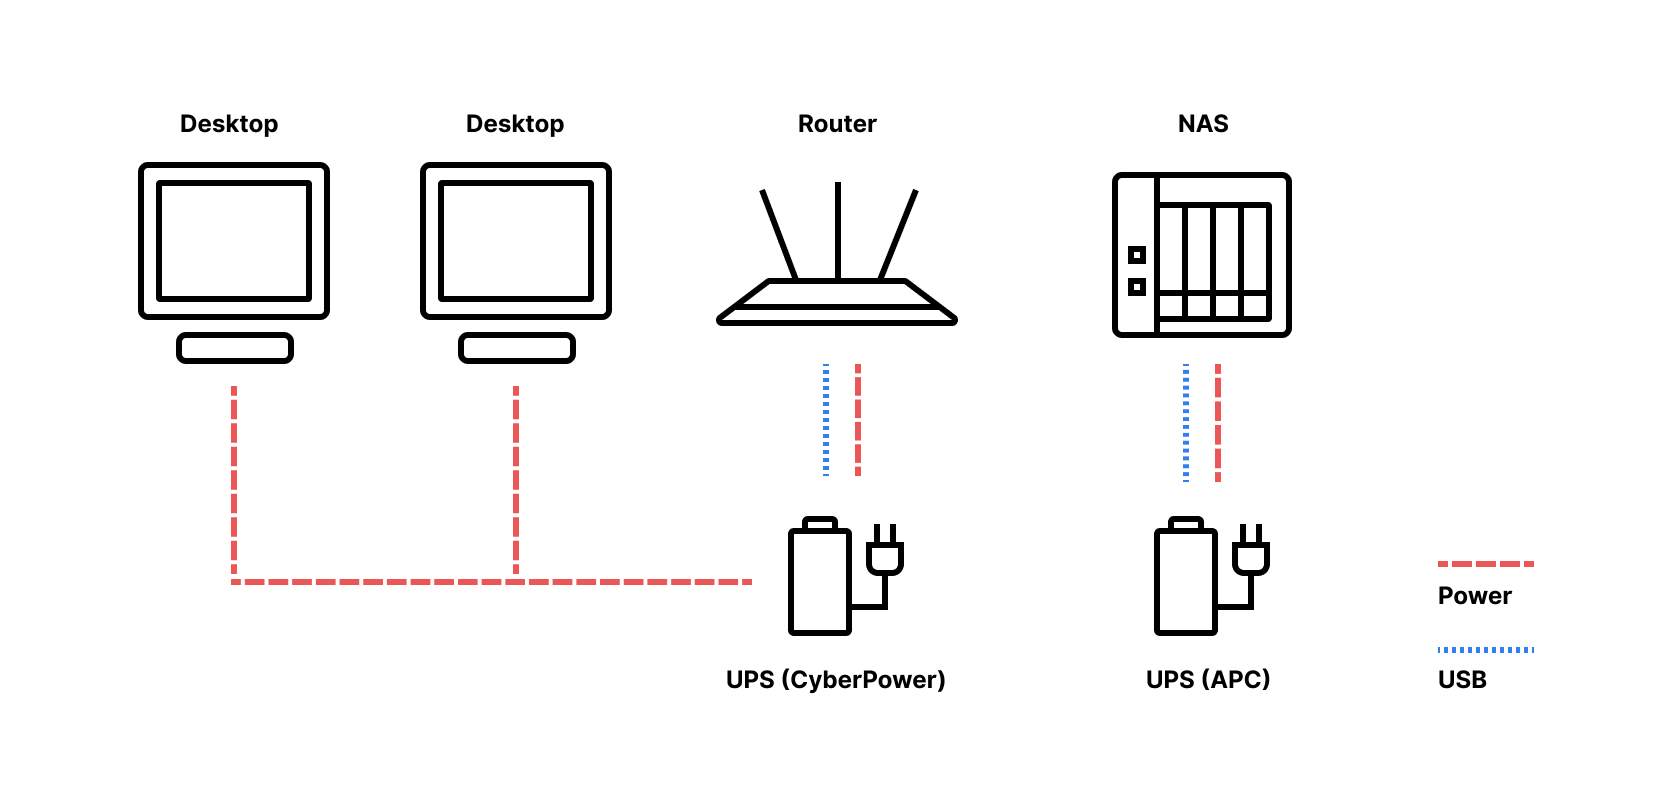
- QNAP TS-451 NAS
- Netgear R7000 router
- CyberPower CP1500PFCLCD
- APC Back-UPS BN1080G
The NAS is connected to the APC UPS. In another room, we have the router and a couple desktop connected to the CyberPower UPS:
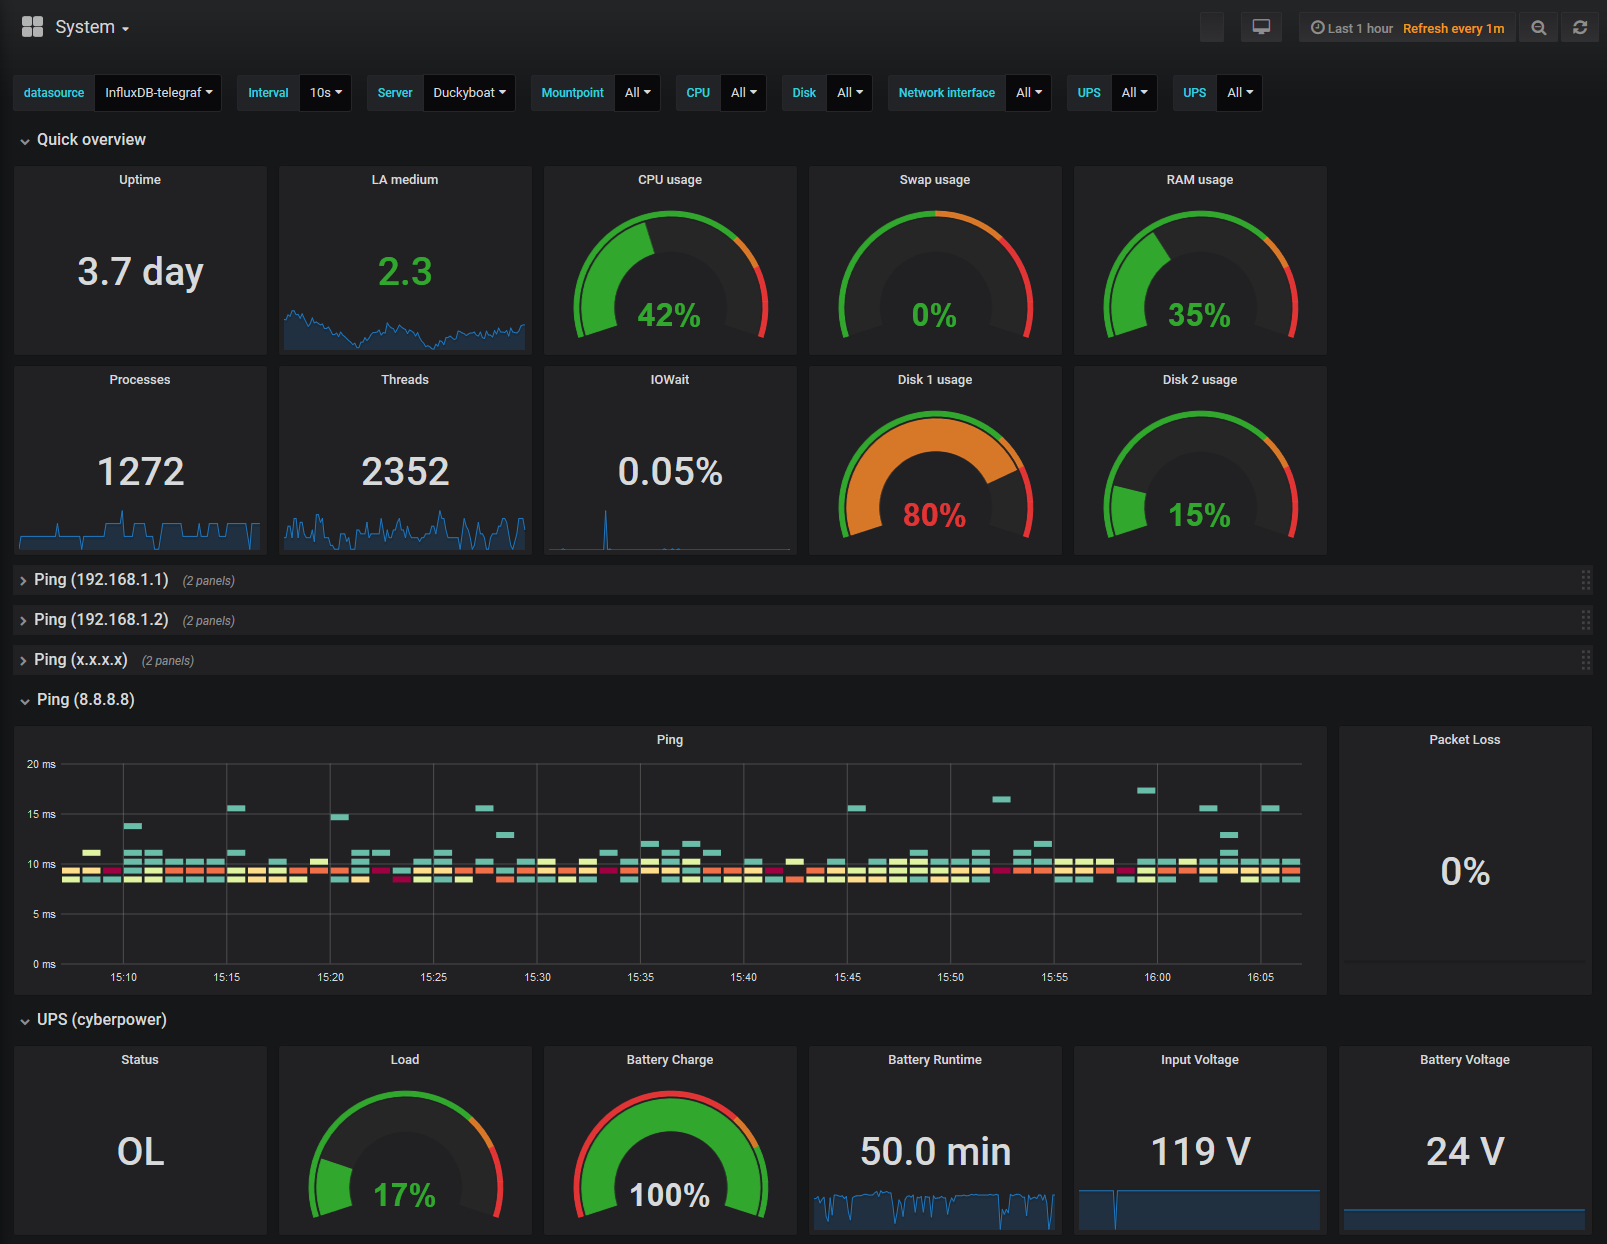
We’re using Telegraf to continuously collect metrics from the NAS and UPSes, and storing them in InfluxDB, a time-series database. We use Grafana to make a dashboard that visualizes metrics stored in InfluxDB. Telegraf has a bunch of built-in plugins to read system metrics like CPU usage, memory, and so on, but for UPS metrics, we have our own script that pulls from Network UPS Tools (NUT).

All the software, except NUT, runs as individual containers in Docker, to make it easy to install and manage. This means you can set this up on any machine, not just a QNAP NAS.
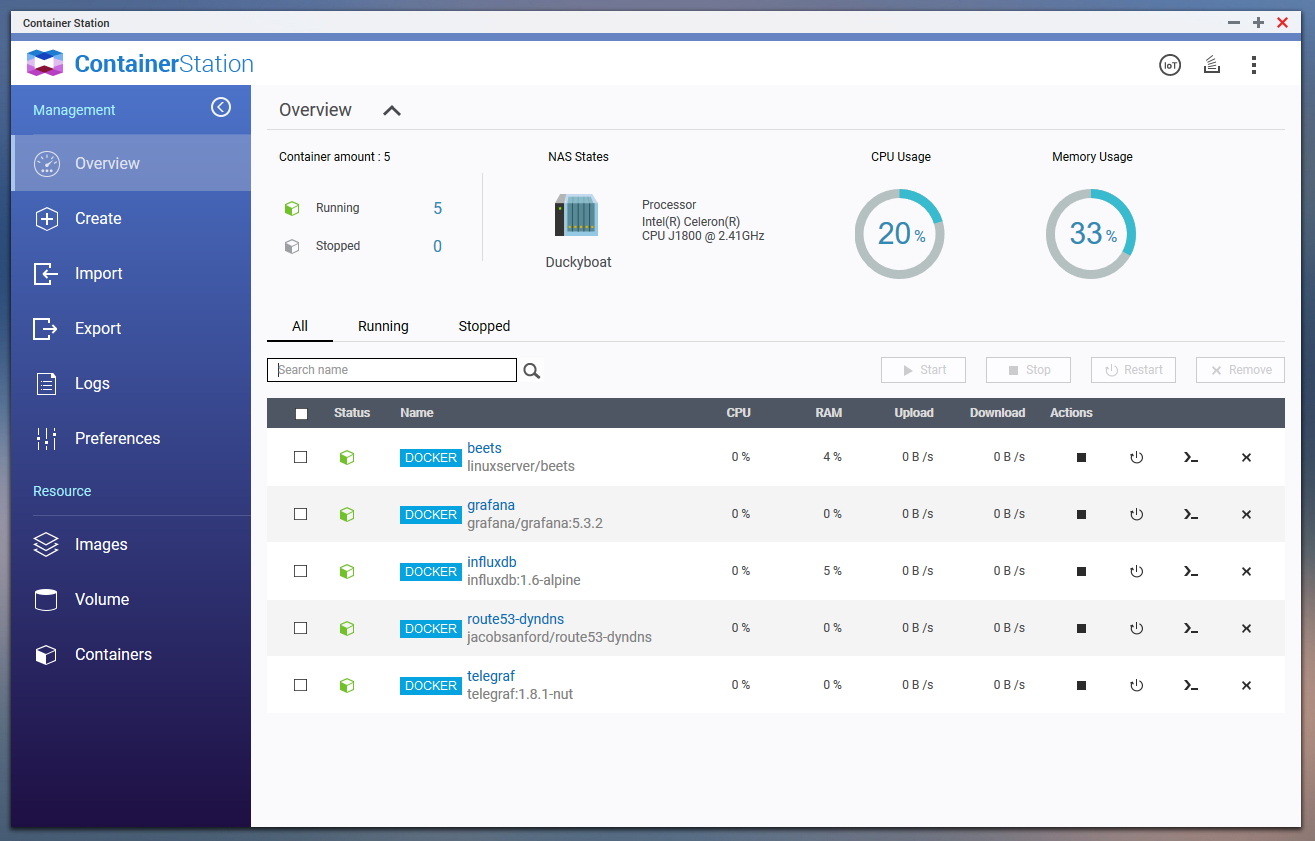
QNAP Container Station aka fancy Docker frontend
First, we need to set up a Docker network so that the containers can find each other by hostname. Run this, and all following commands through SSH as the admin user.
docker network create monitoring
We’ll store all container data under /share/Containers but this can be in a different location.
mkdir -p /share/Containers/influxdb/{data,meta,wal}
mkdir -p /share/Containers/grafana
mkdir -p /share/Containers/telegraf/collectors
InfluxDB
InfluxDB is used to store and query all our metrics. It works pretty much perfectly out of the box, so all we have to do is create a config file and start it.
docker run --rm influxdb:1.6-alpine influxd config > /share/Containers/influxdb/influxdb.conf
docker run -d \
    --name=influxdb \
    --network monitoring \
    -p 8086:8086 \
    -v /share/Containers/influxdb/data:/var/lib/influxdb/data \
    -v /share/Containers/influxdb/meta:/var/lib/influxdb/meta \
    -v /share/Containers/influxdb/wal:/var/lib/influxdb/wal \
    -v /share/Containers/influxdb/influxdb.conf:/etc/influxdb/influxdb.conf:ro \
    influxdb:1.6-alpine -config /etc/influxdb/influxdb.conf
Grafana
Grafana is the dashboard tool we’re using to visualize the metrics in charts, heatmaps, gauges, and so on. This one is also very straightforward to set up. First, start the container.
docker run -d \
    --name grafana \
    --network monitoring \
    -p 3000:3000 \
    -v /share/Containers/grafana:/var/lib/grafana \
    -e "GF_AUTH_ANONYMOUS_ENABLED=true" \
    grafana/grafana:5.3.2
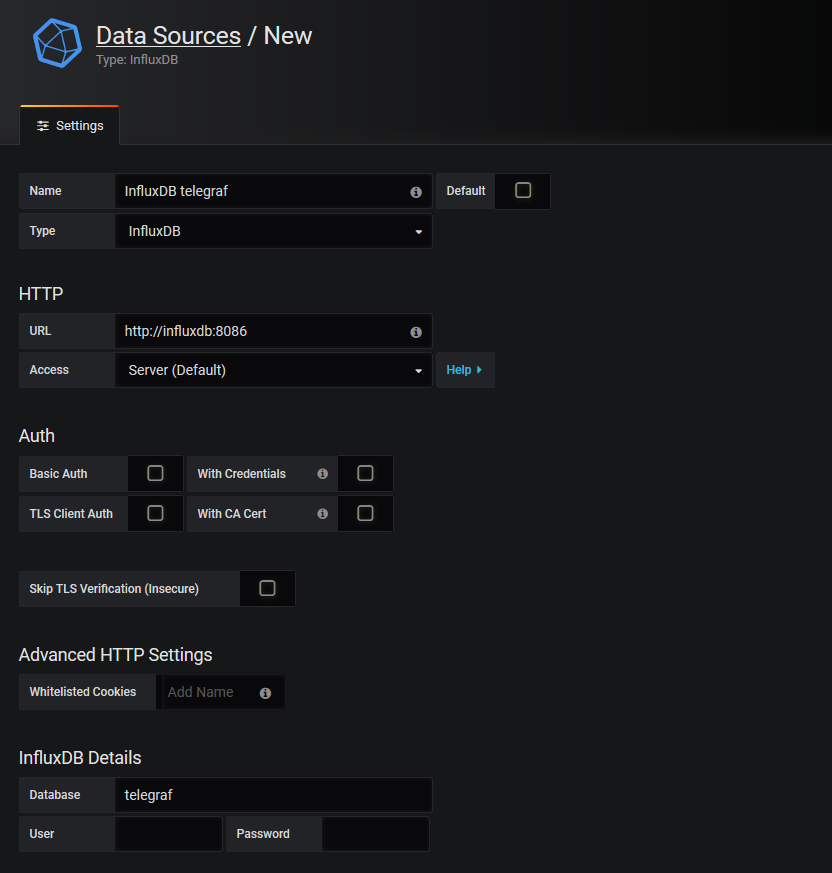
Next, open the Grafana web interface at http://your-server-change-me:3000, open Configuration → Data Sources and add a new data source that points to the InfluxDB container at http://influxdb:8086. Set the database to telegraf.
Download the Grafana dashboard JSON file and import it by uploading in Dashboards → Manage.
Telegraf
Telegraf is used to gather metrics from the host system (CPU, memory, disk usage, etc) and from the UPSes. We need to use the NUT upsc tool to get UPS status. This is not included in the stock Telegraf container, so let’s make one that includes nut-client package with the following Dockerfile.
FROM telegraf:1.8.1

RUN DEBIAN_FRONTEND=noninteractive apt-get update && \
    DEBIAN_FRONTEND=noninteractive apt-get install -y --no-install-recommends nut-client && \
    rm -rf /var/lib/apt/lists/*
/share/Containers/telegraf/Dockerfile
docker build -t telegraf:1.8.1-nut /share/Containers/telegraf
Configure
Telegraf doesn’t have built-in support for UPS metrics, so we’ll need a small script to parse the output of the upsc tool, which outputs UPS status as a set of key-value pairs, and convert it to the InfluxDB Line Protocol.
$ upsc qnapups
battery.charge: 100
battery.runtime: 5932
ups.status: OL
ups,ups=qnapups battery_charge=100,battery_runtime=5932,status=OL 1541308559146894693
You might want to tweak the tags and fields in the following script to add additional metrics supported by your UPS, or remove ones that aren’t available. Check the output of upsc for reference.
#!/bin/bash
#
# Query NUT UPS status and output in InfluxDB Line Protocol
#
# Usage: ups.sh upsname[@hostname[:port]]
# (same as `upsc`, see https://networkupstools.org/docs/man/upsc.html)
#
set -euo pipefail
IFS=$'\n\t'

function join { local IFS="$1"; shift; echo "$*"; }

declare -A vars=();

# read UPS status into `vars`
while IFS=": " read -r k v; do
  vars[$k]="$v"
done < <(upsc $* 2>/dev/null)

# exit if empty/unsuccessful
[[ -z "${vars-}" ]] || exit 1

# print a metric in InfluxDB line format
tags=(
  ups=${1%%@*}
)
fields=(
  status=${vars["ups.status"]}
  load=${vars["ups.load"]}
  battery_charge=${vars["battery.charge"]}
  battery_runtime=${vars["battery.runtime"]}
  battery_runtime_low=${vars["battery.runtime.low"]}
  battery_voltage=${vars["battery.voltage"]}
  battery_voltage_nominal=${vars["battery.voltage.nominal"]}
  input_voltage=${vars["input.voltage"]}
  input_voltage_nominal=${vars["input.voltage.nominal"]}
  timer_reboot=${vars["ups.timer.reboot"]:--1}
  timer_shutdown=${vars["ups.timer.shutdown"]:--1}
)
time=$(date +%s%N)

echo "ups,$(join , ${tags[@]}) $(join , ${fields[@]}) $time"
/share/Containers/telegraf/collectors/ups.sh
Next, create a Telegraf config file and modify it to write to InfluxDB, and call the ups.sh script to collect UPS metrics. You can also enable other plugins to get system metrics. See the Telegraf docs for more information.
docker run --rm telegraf:1.8.1-nut telegraf config > /share/Containers/telegraf/telegraf.conf
Update the commands section below to point to the UPSes of your choice. When running on a QNAP box as the Docker host, use qnapups@dockerhost to refer to the UPS connected to it.
[[outputs.influxdb]]
  ## The full HTTP or UDP URL for your InfluxDB instance.
  urls = ["http://influxdb:8086"]

# Read metrics from one or more commands that can output to stdout
[[inputs.exec]]
  ## Commands array
  commands = [
    "/var/lib/telegraf/collectors/ups.sh qnapups@dockerhost",
    "/var/lib/telegraf/collectors/ups.sh cyberpower@192.168.1.2"
  ]

  ## Timeout for each command to complete.
  timeout = "5s"

  ## Data format to consume.
  data_format = "influx"

# Ping given url(s) and return statistics
[[inputs.ping]]
  ## List of urls to ping
  urls = [
    "8.8.8.8",
    "192.168.1.1",
  ]
/share/Containers/telegraf/telegraf.conf
Finally, run the Telegraf container. The command below mounts a bunch of stuff to allow Telegraf to get system metrics about the host, rather than the container, which is typically more useful.
We’re also adding a hostname for the Docker host, used in the Telegraf config to grab UPS metrics from the UPS connected to the host, which is running the NUT upsd server.
docker run -d \
    --name=telegraf \
    --network monitoring \
    --add-host=dockerhost:$(docker network inspect --format='{{range .IPAM.Config}}{{.Gateway}}{{end}}' monitoring) \
    --cap-add net_raw \
    --cap-add net_admin \
    --hostname=$HOSTNAME \
    -v /share/Containers/telegraf/telegraf.conf:/etc/telegraf/telegraf.conf:ro \
    -v /share/Containers/telegraf/collectors:/var/lib/telegraf/collectors:ro \
    -v /:/hostfs:ro \
    -v /etc:/hostfs/etc:ro \
    -v /proc:/hostfs/proc:ro \
    -v /sys:/hostfs/sys:ro \
    -v /var/run/utmp:/var/run/utmp:ro \
    -v /var/run/docker.sock:/var/run/docker.sock:ro \
    -e HOST_ETC=/hostfs/etc \
    -e HOST_PROC=/hostfs/proc \
    -e HOST_SYS=/hostfs/sys \
    -e HOST_MOUNT_PREFIX=/hostfs \
    telegraf:1.8.1-nut
Now that everything is running, you should see metrics show up in Grafana.
Troubleshooting
If metrics aren’t showing up, check Telegraf logs first. Most likely, there’s a configuration issue that it will complain about.
docker logs telegraf
UPS metrics may not work if there are connection issues between the Telegraf container and the NUT upsd server. Check that upsc in the container can get the metrics, or if it returns some errors.
$ docker exec telegraf upsc qnapups@dockerhost
battery.charge: 100
battery.charge.low: 10
battery.charge.warning: 50
...

$ docker exec telegraf /var/lib/telegraf/collectors/ups.sh qnapups@dockerhost
ups,ups=qnapups status="OL",load=6,battery_charge=100,... 1541310799811208372
Up next
In a future post, we’ll look into some challenges I ran into when setting this up, including reverse engineering the QNAP upsd binary to debug a mysterious error message that was nowhere to be found in the NUT source code.
